Why electricity prices can rise when renewable generation is strong
What an August price spike shows about wholesale electricity prices, and why generation mix alone does not explain the final price.
Ask how an energy community could help your area manage energy-price uncertainty
Why electricity prices can rise when renewable generation is strong
Electricity prices are often explained through a single visible event: a change in weather, an eclipse, or a drop in wind output. The August charts supplied for this article point to a more useful question: what determines the wholesale price when generation comes from several sources at once?
The answer is not simply the share of each fuel in the monthly generation mix. In the EU wholesale market, electricity is priced through marginal, or pay-as-clear, pricing: generators submit offers and, once demand is met, the accepted generators receive the price of the last generator needed to meet that demand.[1]
That mechanism matters because a fuel can be a small part of total generation over a month yet still be required in particular intervals. It does not mean that a monthly gas share alone proves gas set the price in every hour. Establishing that would require interval-level dispatch and market-clearing evidence for the relevant bidding zone.
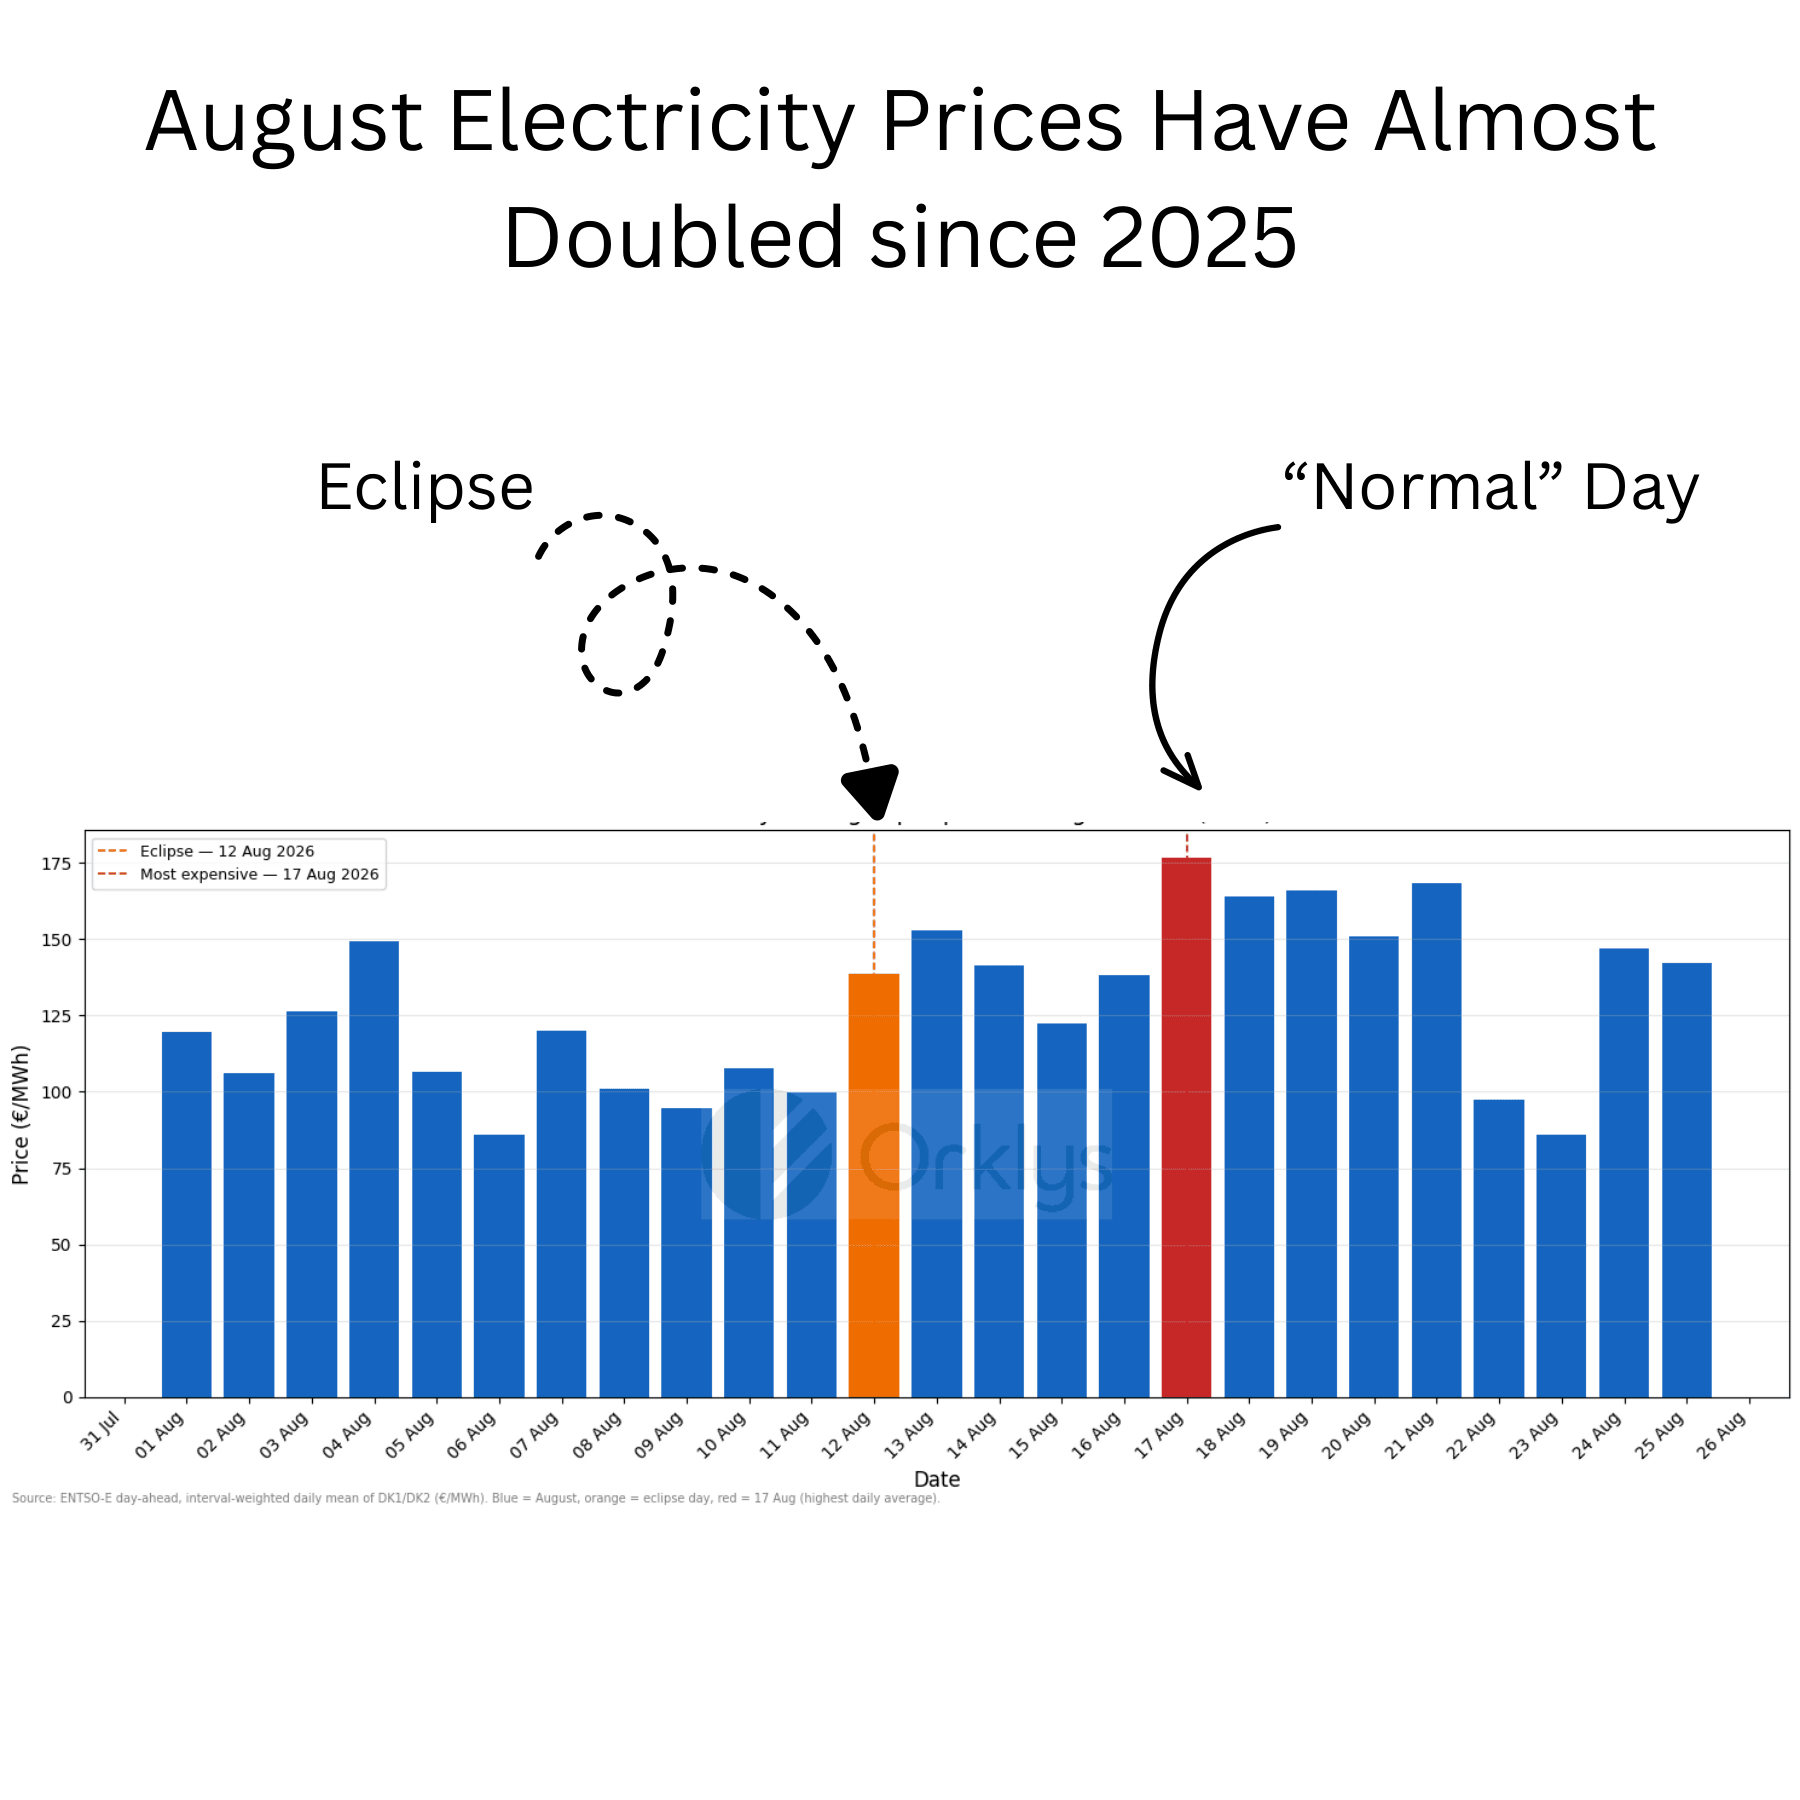
Figure 1 (hero). Orklys analysis of ENTSO-E day-ahead data. The chart labels prices as an interval-weighted daily mean of DK1 and DK2 in €/MWh; blue bars show August days, orange marks 12 August 2026 and red marks 17 August 2026.
A visible event is not necessarily the price driver
The first chart shows a higher weighted daily price on 17 August than on the eclipse date, 12 August. It is therefore not evidence that the eclipse itself explains the month’s peak price. The chart is a starting point for examining price formation, not proof of causation.
It also represents a wholesale, day-ahead measure. Wholesale prices sit at one end of the electricity supply chain; an end user’s bill also depends on the customer’s tariff, network charges, taxes, supplier terms and any hedging or fixed-price arrangement.[1]
Why the mix is only part of the explanation
The second chart compares an August electricity-generation mix for Denmark and Germany. It presents Denmark as wind- and solar-heavy and labels total generation as 2,352 GWh; it presents Germany as more mixed and labels 28,034 GWh. The figure also depicts gas as a visibly smaller share in Denmark than in Germany.
That is useful context, but it should not be overstated. A monthly mix is an aggregate view. Wholesale prices are set at specific market intervals, where expected demand, available generation, interconnector capacity, bids and the marginal unit can all matter. The European Commission describes the EU market as a marginal-price system in which the cheapest offers are bought first and the final accepted offer determines the price for the electricity sold in that moment.[1]
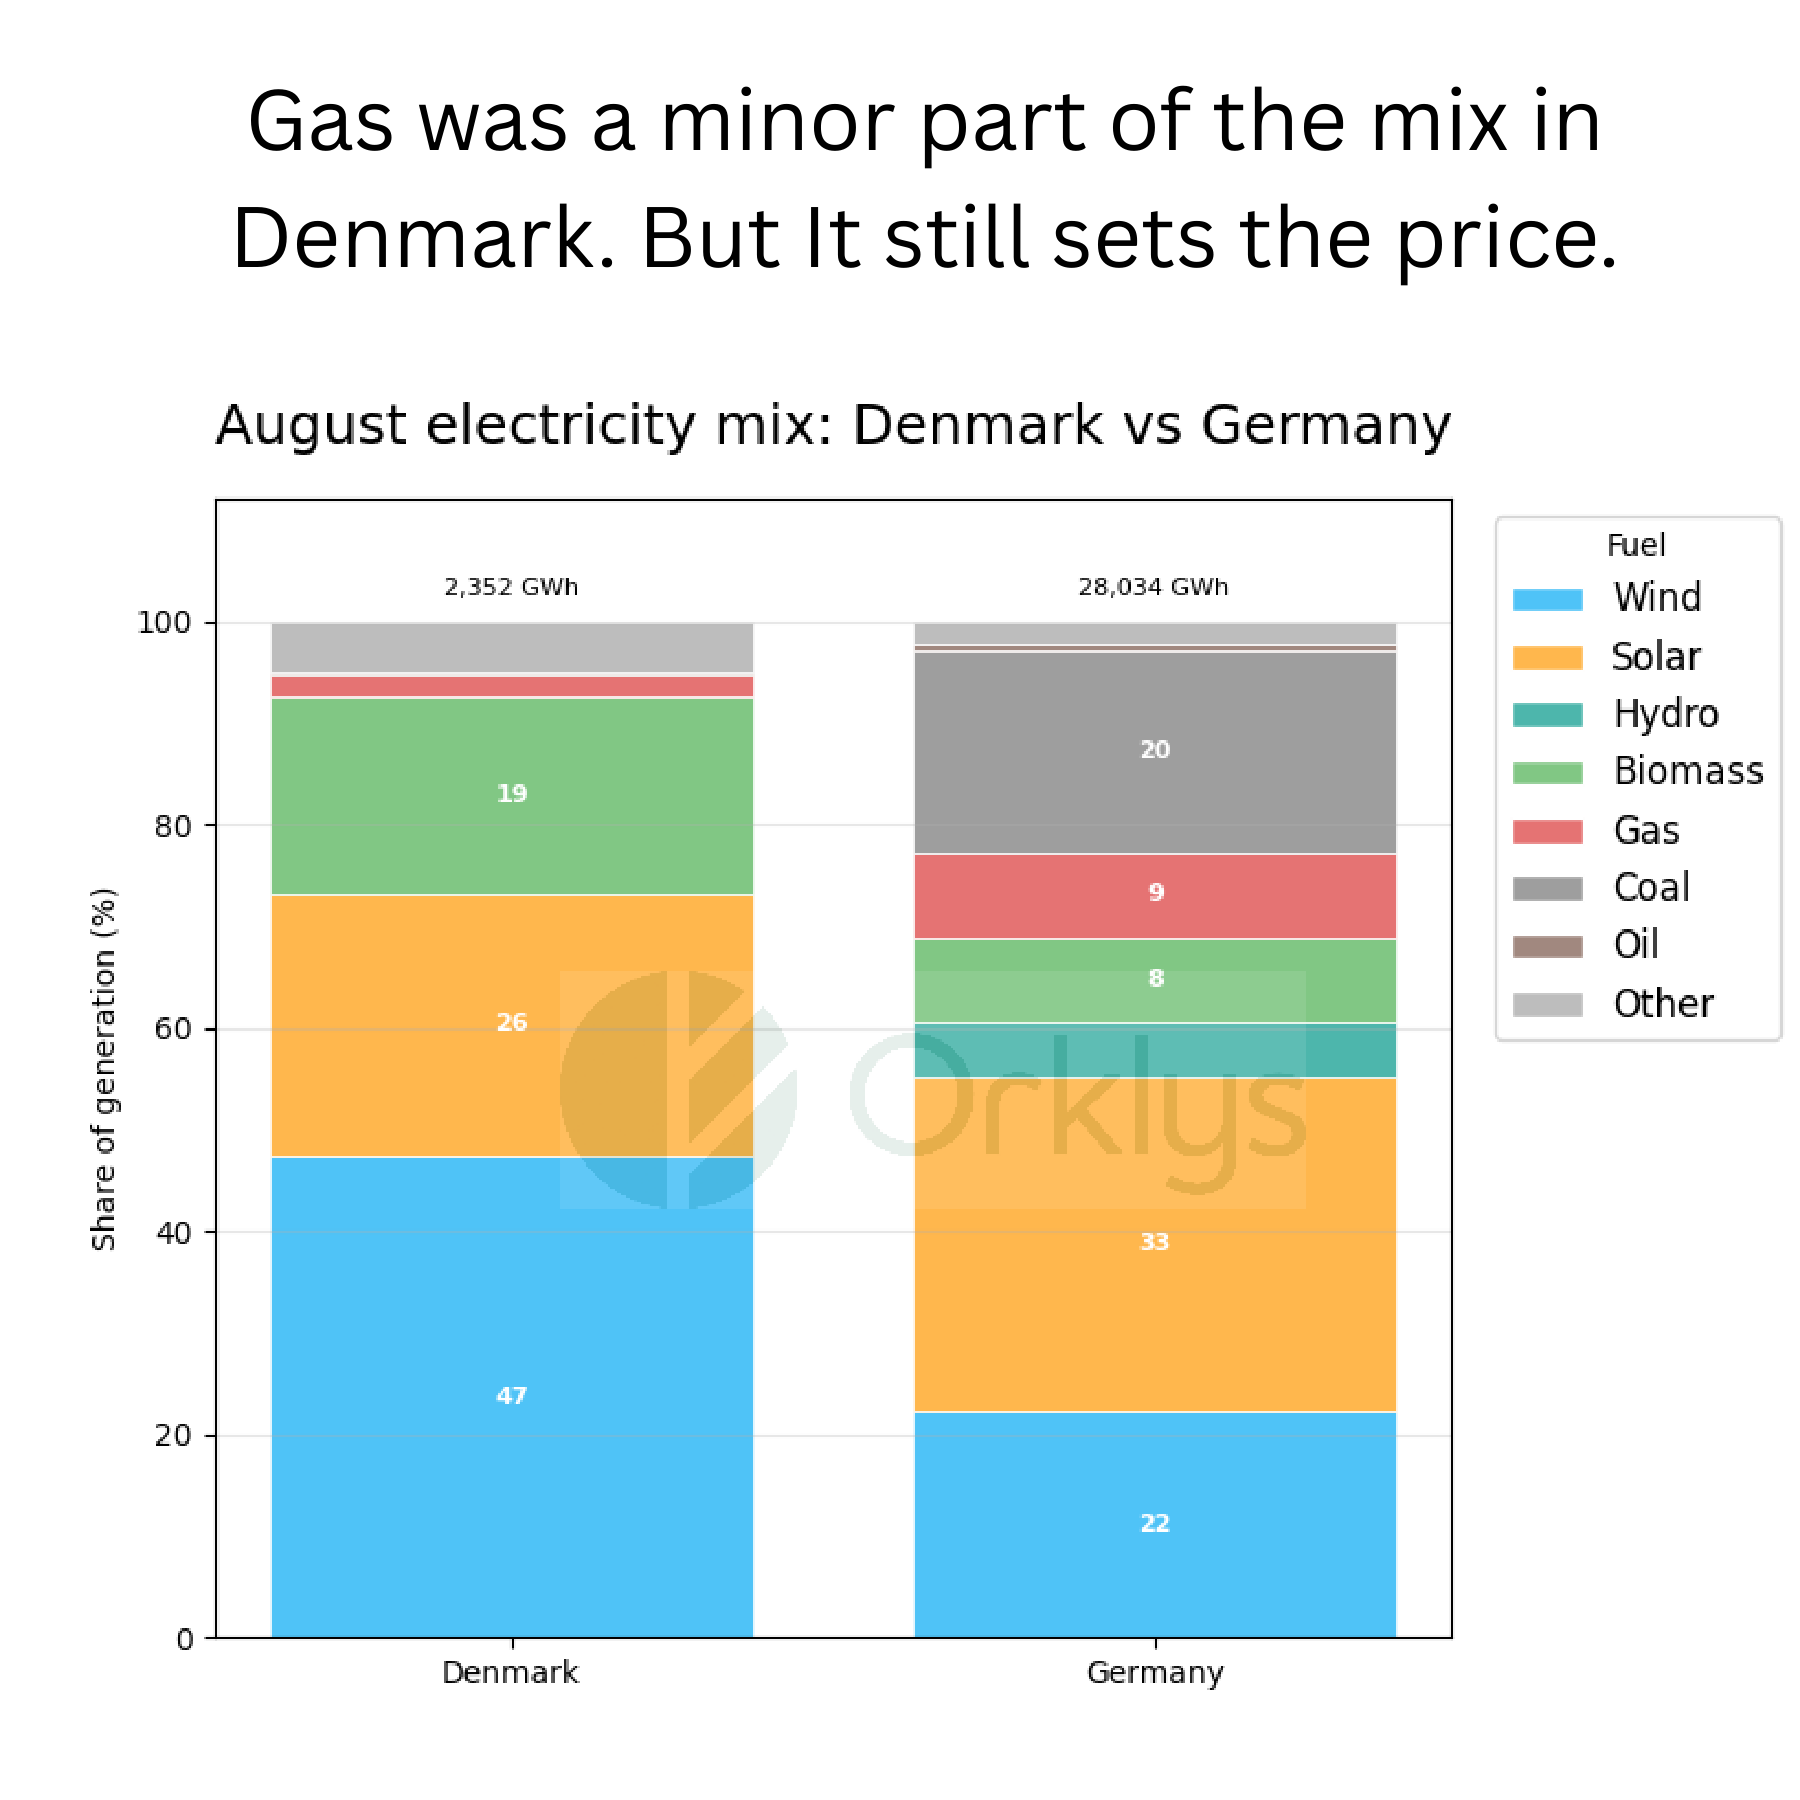
Figure 2. Supplied Orklys marketing analysis of the August generation mix. It labels Denmark and Germany’s generation shares and totals as 2,352 GWh and 28,034 GWh respectively.
An unusually expensive summer requires a clear comparison
The final chart compares Danish summer spot prices in June, July and 1–24 August for 2024, 2025 and 2026. It shows the 2026 series above the earlier series in each displayed month and highlights the August 2026 value as the highest plotted point.
The figure’s own note says it uses ENTSO-E day-ahead prices in €/MWh and that the August window is 1–24 in every year. That consistent August window is important: it prevents a partial current month from being compared with a complete August. The chart is published as Orklys marketing analysis of the supplied data, rather than an independently audited market-data series.
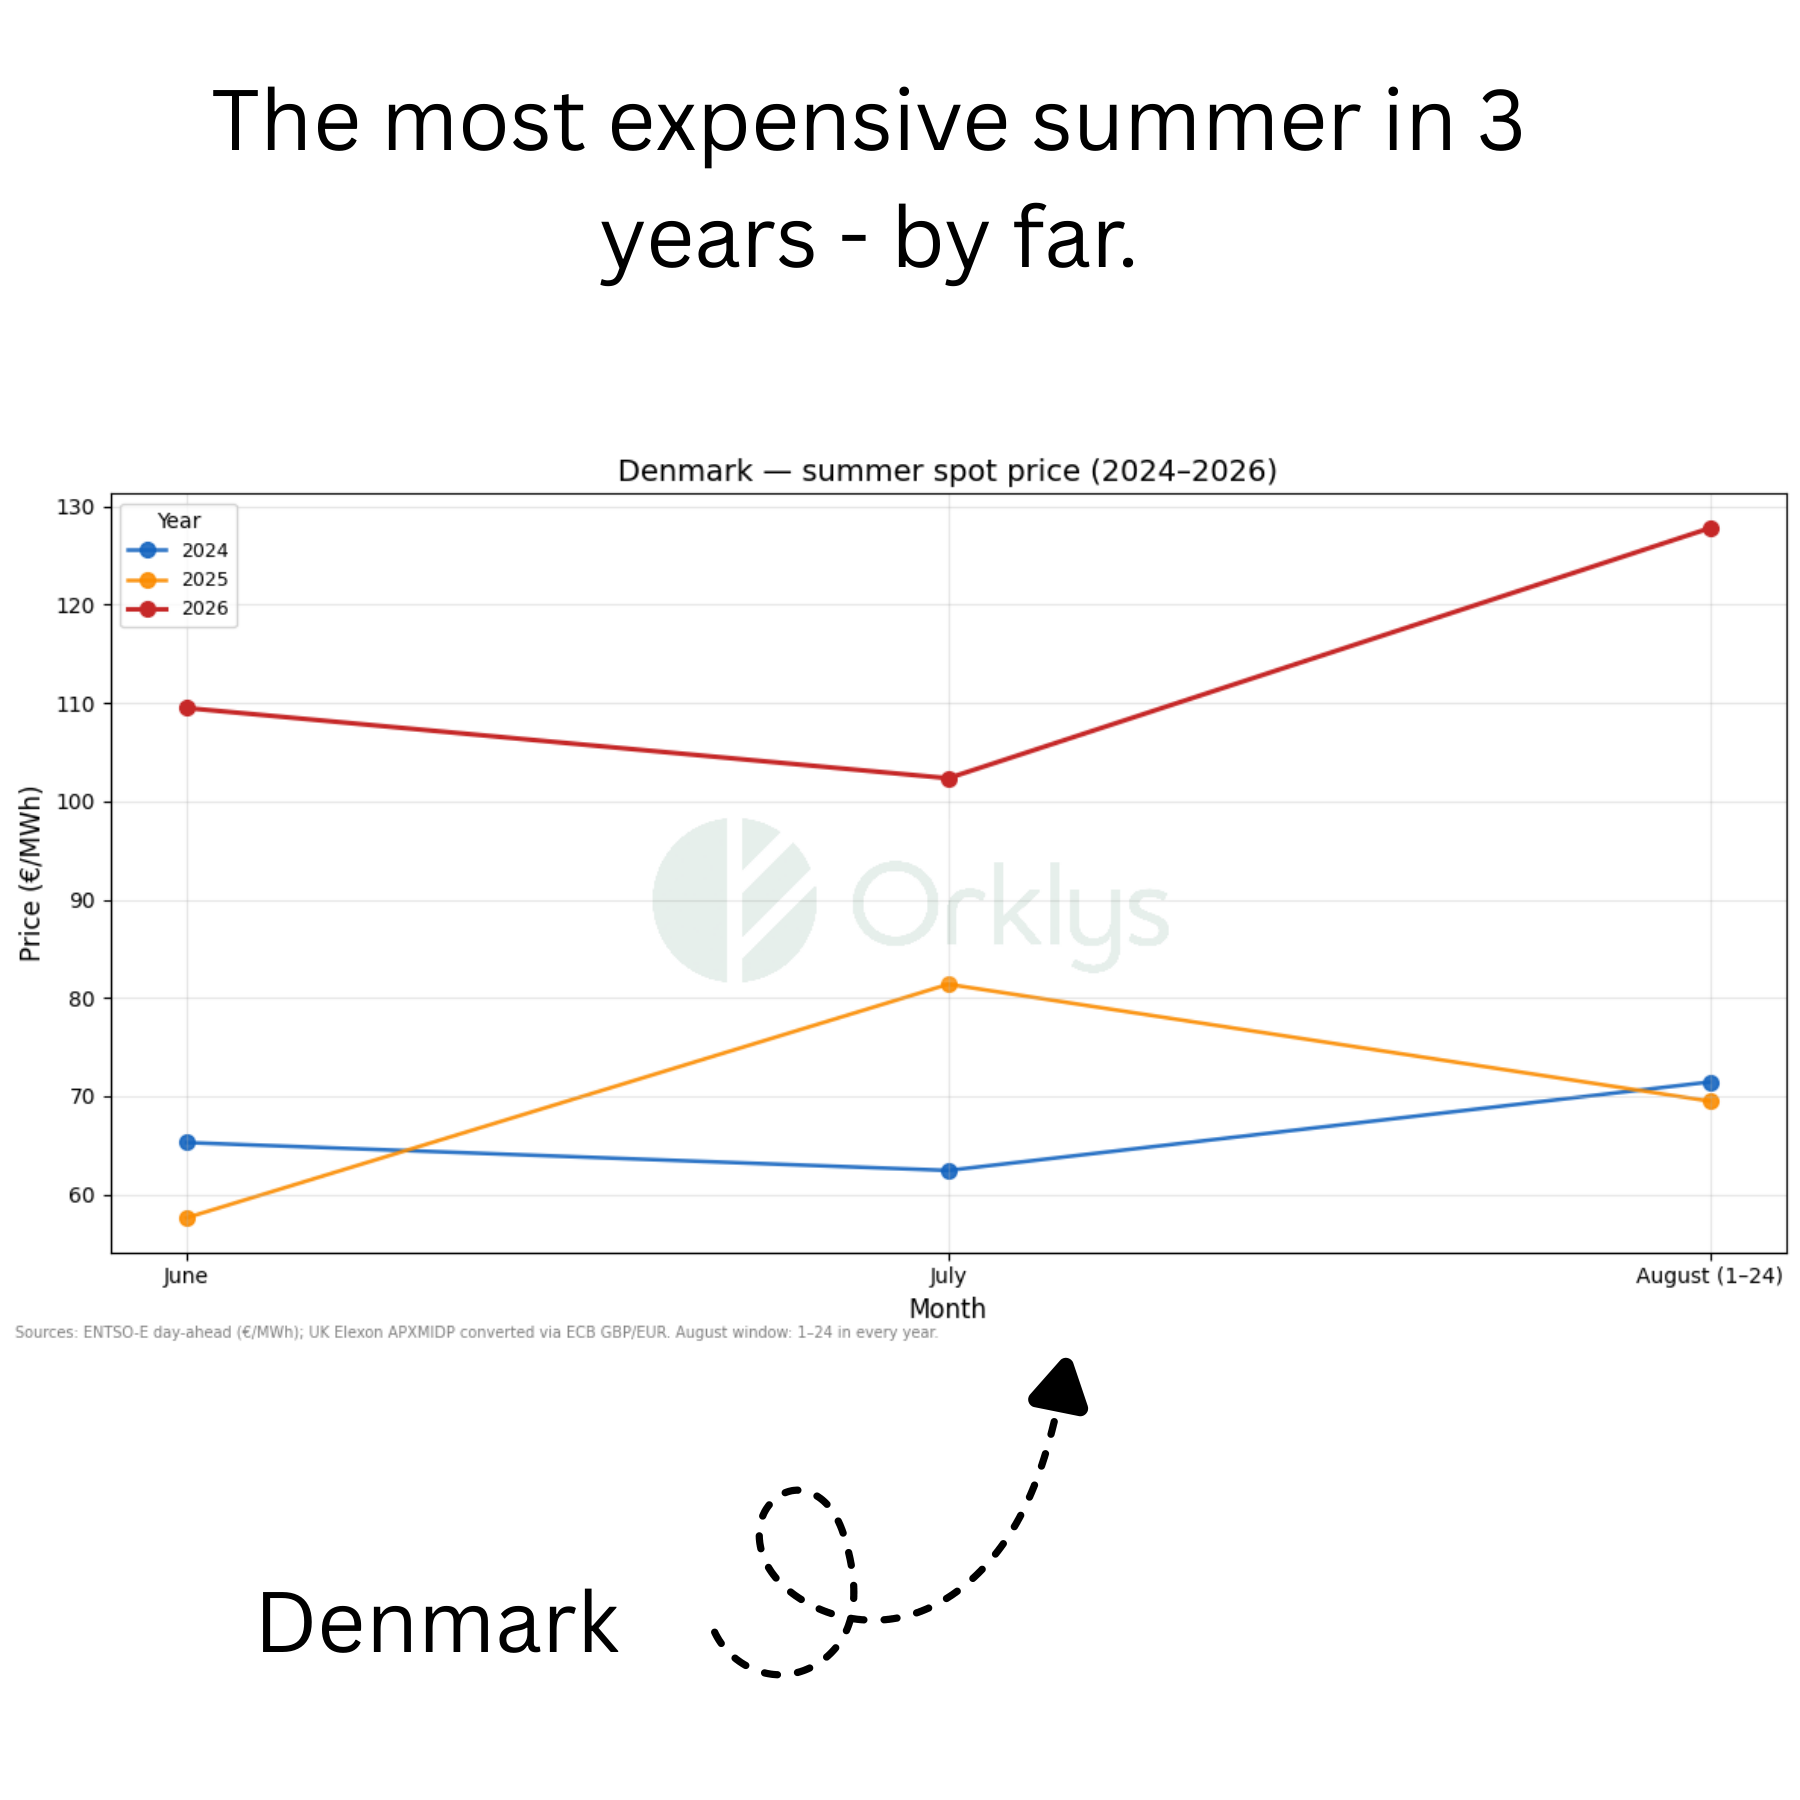
Figure 3. Supplied Orklys marketing analysis comparing Denmark’s summer spot-price series in €/MWh across 2024–2026. The chart notes ENTSO-E day-ahead data and UK Elexon APXMIDP converted through ECB GBP/EUR.
Building resilience is different from promising certainty
For households, businesses and communities, the practical lesson is not that one generation technology automatically removes exposure to market movements. The appropriate response depends on the project’s technology, local demand, financing, storage, network arrangements, contract structure and applicable regulation.
Community-owned energy can be worth assessing as one way to give local people and businesses more agency in how energy is generated, shared and managed. It should be evaluated as a project-specific option—not as a guarantee of lower bills or immunity from future price shocks.
Ask a practical question about your local project
Use the AI question box above to explore a first question about building an energy community, such as what information is needed to assess a local wind, solar or mixed-energy project.
Data and method note
Figures 1–3 are supplied Orklys analysis graphics. Figure 1 states: ENTSO-E day-ahead, interval-weighted daily mean of DK1/DK2 (€/MWh). Figure 3 states: ENTSO-E day-ahead (€/MWh); UK Elexon APXMIDP converted through ECB GBP/EUR; August window 1–24 in every year. Figure 2 does not disclose a source, year or calculation method in the supplied PDF.
This article distinguishes what the graphics show from claims about interval-specific price formation. The chart calculations, source provenance, market-zone treatment and any causal explanation require an energy-domain review before publication.